This month we challenged you to think of ways to make your data sexy. Our takeaway was that data can, in fact, be engaging, memorable, and even sexy. It’s up to you to make it sizzle.
We realize that this advice is easier said than done. For that reason, we thought it would be helpful to give you a quick list of examples that can help you illustrate your data in vivid and concrete ways.
Statistics
Select and compelling statistics help make our data stand out.
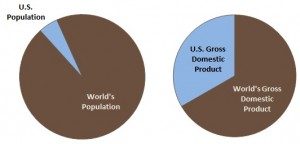
Example: The U.S. represents less than 5 percent of the world’s population; yet, the nation’s economy represents virtually a third of the world’s gross domestic product.
Visuals
You could present the same statistic visually.
Example:
Analogies
Analogies can quickly relate our data or concepts to something familiar.
Example: Developing products quickly is a lot like running a relay: It doesn’t matter how fast you go if the handoffs aren’t smooth.
Examples
Specific examples can help illustrate our data.
Example: Last month, a client of ours installed the software and saw a 30 percent improvement in productivity.
Stories
Stories, used well, can provide context for our data.
Example: To reinforce the spirit of innovation with its employees, Nike shares a story about Bill Bowerman who co-founded Nike with Phil Knight and coached the legendary Olympic runner, Steve Prefontaine.
The story goes that Coach Bowerman decided his team needed better running shoes than he could find on the market. So, he went to his workshop and poured rubber into a family waffle iron and began producing shoes.
Data can be engaging — even sexy, and most of all memorable, if you take the time to think of ways to make it come to life in with concrete and vivid language or visuals that the audience can understand and envision. And, they will remember your data because you took the time to make it memorable.
We’d love to hear your own examples of how you are making your data come alive.


